


 6 Demo templates added - Ready-to-use dashboards tailored for every key role in your organization.
-
 CEO
CEO  CFO
CFO
 Delivery Manager
 Sales Manager
 Marketing Manager
 Purchase Manager
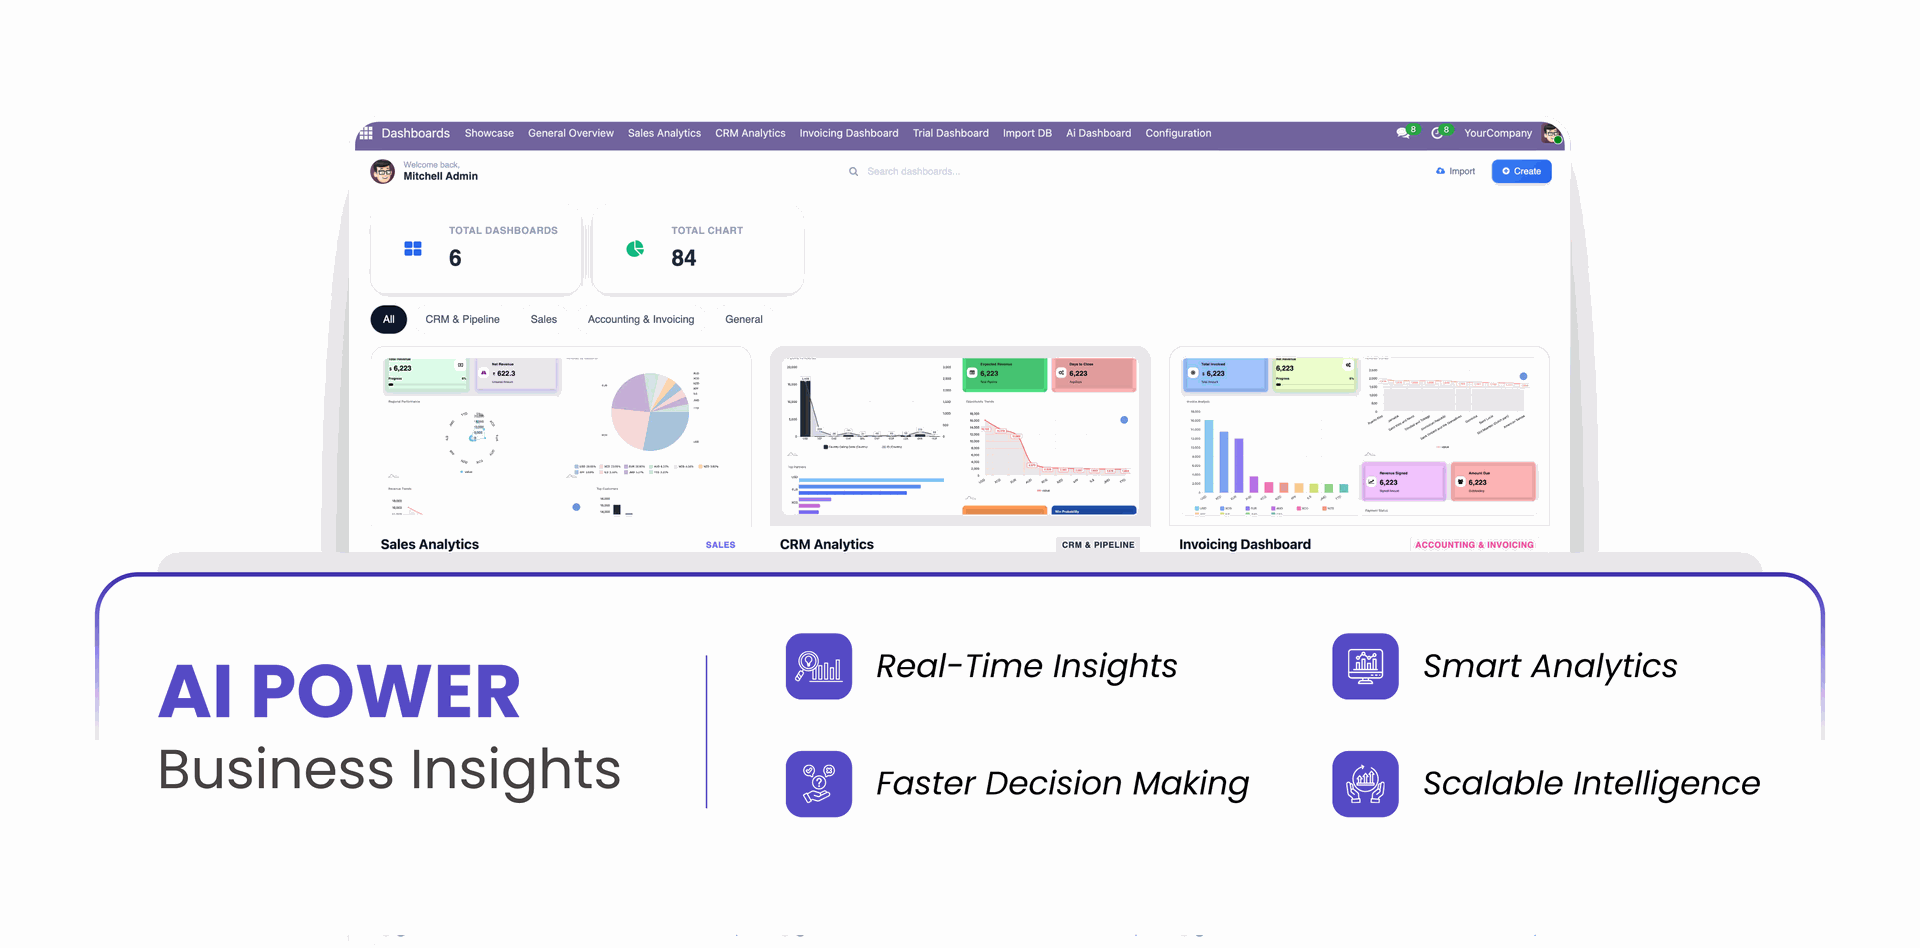
AI Dashboard Studio - From Data to Decisions

Transform your Odoo data into actionable insights with a powerful and intelligent AI-driven dashboard that brings all your analytics and visual reports into one unified interface. The AI Dashboard Generator module empowers you to build stunning, interactive, and real-time dashboards using advanced charts. This module enables users to monitor performance, analyze trends, and interact with dynamic charts using advanced visualization tools, export options, and real-time customization capabilities. Designed for flexibility and usability, the AI Dashboard provides a modern analytics experience where users can explore data visually, annotate insights, customize themes, and export reports instantly.
Key Features


Explore Module


Chart Types


Version 18.0.2.0.0 | Released on : 1st May 2026
Version 18.0.1.0.0 | Released on : 28th November 2025
- Yes, this app works perfectly with Odoo Enterprise (Odoo.sh & Premise) as well as Community.
- No, this application is not compatible with odoo.com(odoo saas/Odoo Online)
- Yes, to test this module, please contact us at sales@softhealer.com.
- Please contact us at sales@softhealer.comto request customization.
- Yes, we provide free support for 365 days from the date of purchase.
- Yes, you will receive lifetime free updates for the version of the module you purchased.
- No, there is no need to install any additional libraries.
- Yes, for version 12 and above, you need to purchase the module separately for each version you intend to use.
- No, exchanges or refunds are not allowed. Please make sure to select the correct version before purchasing.
- You can contact us at support@softhealer.com for language translation support. We use Google Translator tools to provide translations in multiple languages, so the accuracy may vary. We welcome your suggestions to help improve translations.


Discover Our Latest Apps